Create analysis pipeline
Consider parseq_XES_scan and parseq_XAS as examples for the development steps described below.
Centralized facilities
Nodes and transformations
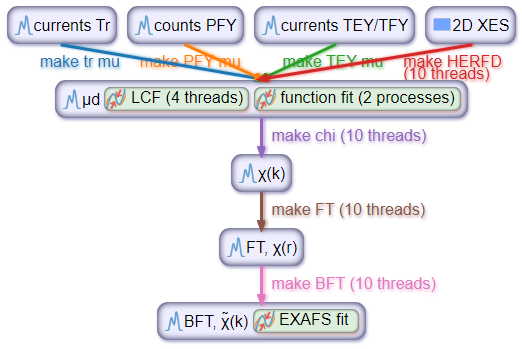 A pipeline for data processing of XAS spectra. This pipeline has
multiple entry nodes and three fitting routines.
A pipeline for data processing of XAS spectra. This pipeline has
multiple entry nodes and three fitting routines.A pipeline for data processing of XAS spectra. This pipeline has multiple entry nodes and three fitting routines.
An analysis pipeline consists of data nodes and transformations that connect the nodes, see an example on the right.
Data nodes define array names that will appear as attributes of data objects,
e.g as item.x, with x being an attribute of a data object item. The
array values will be read from files or calculated from other arrays. The
pipeline can be used with or without GUI widgets. In the former case, the
defined node arrays will appear in the node plot: 1D, 2D or 3D (a stack of 2D
plots).
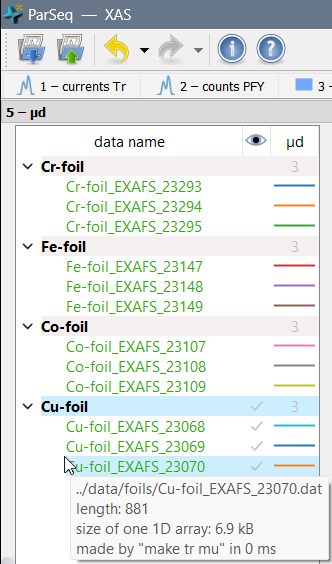 EXAFS data arranged in a tree. The item tooltips present data
flow information, array sizes and error messages.
EXAFS data arranged in a tree. The item tooltips present data
flow information, array sizes and error messages.EXAFS data arranged in a tree. The item tooltips present data flow information, array sizes and error messages.
The data tree model (as in the Qt’s Model/View Programming concept) is a single object throughout the pipeline. In contrast, data tree widgets, see an example on the left, are present in each data node, not as a single tree instance, with the idea also to serve as a plot legend. Data can be rearranged by the user: ordered, renamed, grouped and removed. User selection in the data model is common for all transformation nodes. For 1D data, the line color is the same in all data nodes. 1D data plotting can optionally be done for several curves simultaneously: being selected either dynamically (via mouse selection) or statically (via check boxes). 2D and 3D data plotting is always done for one selected data object.
Each transformation class defines a dictionary of transformation parameters and default values for them. It also defines a static method that calculates data arrays. The transformation parameters will be attributed to each data object. The parameter values are supposed to be changed in GUI widgets. This change can be done simultaneously for one or several active data objects. Alternatively, any parameter can be copied to one or several later selected data.
Each transformation can optionally define the number of threads or processes
that will start in parallel to run the transformation of several data items.
The multiprocessing python API requires the main transformation method as a
static or class method (not an instance method). Additionally, for the sake
of inter-process data transfer in multiprocessing, all input and output arrays
have to be added to inArrays and outArrays lists (attributes of the
transformation class).
An example of the apply/reset popup menu on a control element.
In the pipeline GUI widgets, all interactive GUI elements can be registered
using a few dedicated methods of the base class PropWidget. The
registration will enable (a) automatic GUI update from the active data and will
run transformations given the updated GUI elements, so no
signal slots
are typically required. The registration will also enable (b) copying
transformation parameters to other data by means of popup menus on each GUI
element, see on the right.
The transformation class docstrings will be built by ParSeq at the application strat up time using Sphinx into an html file and will be displayed in a help panel close to the transformation widget.
Undo and redo
TODO
File tree views and file formats
TODO
Metadata
TODO
Plots
TODO
Fits
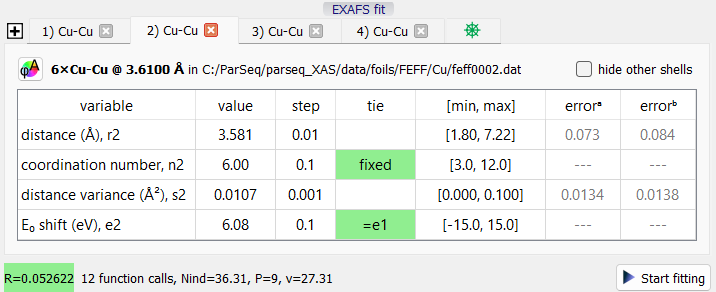 EXAFS fit widget as an example of ParSeq fit widgets. It was
built on top of the ParSeq base fit and base fit widget classes.
EXAFS fit widget as an example of ParSeq fit widgets. It was
built on top of the ParSeq base fit and base fit widget classes.EXAFS fit widget as an example of ParSeq fit widgets. It was built on top of the ParSeq base fit and base fit widget classes.
Data nodes can optionally host curve fitting routines. Similarly to transformations, fitting solvers can run in parallel for several data items. Fitting parameters can be constrained or tied to other parameters, also to parameters of another data item fit. See an example fit widget on the right.
Cross-data combinations
TODO
Standard data corrections
TODO
Project saving with data export and plot script generation
TODO
Command-line interface and start options
TODO
Error handling
TODO
Help system
TODO
Performance profiling
TODO
Prepare pipeline metadata and images
Create a project directory for the pipeline. Create __init__.py file that defines metadata about the project. Note that pipeline applications and ParSeq itself use the module parseq.core.singletons as a means to store global variables; the pipeline’s __init__.py module defines a few of them. Together with the docstrings of the module, these metadata will appear in the About dialog.
Create doc/_images directory and put an application icon there. The pipeline transformations will have class docstrings that may also include images; those images should be located here, in doc/_images.
Make data nodes
To define a node class means to name all plot arrays, define their roles, labels and units. The data containers may also have other array attributes that do not participate in plots; these are not to be declared.
Make data transformations
Start making a transformation class with defining a dictionary defaultParams
of default parameter values. Decide on using multiprocessing/multithreading by
specifying nThreads or nProcesses. If any of these numbers is > 1 (the
default values are both 1), specify two lists of array names: inArrays and
outArrays. Define a static or a class method Transform.run_main().
Note, it can have a few signatures. Within the method, get the actual
transformation parameters from the dictionary data.transformParams and the
defined data arrays as attributes of data, e.g. data.x.
For expensive transformations, you should update the progress status.
For accessing arrays of other data objects, use a different signature of
Transform.run_main() that contains the allData argument. Note that in
this case multiprocessing is not possible.
Make GUI widgets
The widgets that control transformation parameters are descendants of
PropWidget. The main methods of that class are
PropWidget.registerPropWidget() and
PropWidget.registerPropGroup(). They use the Qt signal/slot mechanism to
update the corresponding transformation parameters; the user does not have to
explicitly implement the reaction slots. Additionally, these methods enable
copying transformation parameters to other data by means of popup menus, update
the GUI upon selecting data objects in the data tree, start the corresponding
transformation and operate undo and redo lists.
Because each transformation already has a set of default parameter values, these GUI widgets can gradually grow during the development time, without compromising the data pipeline functionality.
Provide docstrings in reStructuredText markup. They will be built by Sphinx and displayed near the corresponding widgets.
Make fitting worker classes
Similarly to a transformation class, a fitting class defines a dictionary
defaultParams, defines multiprocessing/multithreading and a static or a class
method Fit.run_main().
Make data pipeline
This is a small module that instantiates the above nodes, transformations, fits and widgets and connects them together.
Create test data tree
Put a few data files in a local folder (i.e. data) and create a module that defines a function that loads the data into a data tree, defines suitable transformation parameters and launches the first transformation (the next ones will start automatically).
Create pipeline starter
The starter should understand command line arguments and prepare options for loading the test data and to run the pipeline with and without GUI.
Creating development versions of analysis application
Copy the whole folder of the application to the same level but with a different name, e.g. append a version suffix. In the import section in the start script change the import name to the above created folder name. Done.